TUI Dashboard
Interactive terminal interface for real-time monitoring and control
The Wealth Trading System includes a powerful terminal user interface (TUI) built with Ratatui. It provides real-time monitoring of your trading bot with an intuitive keyboard-driven interface.
Dashboard Navigation
flowchart LR
    subgraph Tabs["TUI Dashboard Tabs"]
        direction TB
        T1["📊 Dashboard<br/>Overview & Opportunities"]
        T2["📈 Positions<br/>Active Positions"]
        T3["🔗 Pairs<br/>Trading Pairs"]
        T4["💰 Funding<br/>Funding Rates"]
        T5["📊 Statistics<br/>Analytics"]
    end

    T1 --> T2
    T2 --> T3
    T3 --> T4
    T4 --> T5
    T5 -.-> T1

    style T1 fill:#e3f2fd
    style T2 fill:#e8f5e9
    style T3 fill:#fff3e0
    style T4 fill:#f3e5f5
    style T5 fill:#ffcdd2
Quick Start
# Run the TUI dashboard
wealth dashboard

# With dynamic pair discovery enabled
wealth dashboard --enable-discovery

# Custom refresh rate (for slow connections)
wealth dashboard --tick-rate 500
Building with TUI Support
The TUI feature must be enabled at compile time:
cargo build --release --features tui
Pre-built binaries from GitHub releases include TUI support by default.
Header Bar
The top header bar displays key metrics at a glance:
| Metric | Description |
|---|---|
| Status | Bot state (Running, Paused, Starting, Shutting Down) with active pair count |
| Bal | Deposited capital across all exchanges (stable, excludes unrealized P&L) |
| Fund | Session funding collected from all positions (including closed) |
| Fees | Session trading fees paid |
| Net | Session cash flow from funding operations (Funding − Fees) |
| Next(1h/8h) | Countdown to next funding window (1h for HyperLiquid, 8h for others) |
Note on Header vs Stats Tab: The header's "Net" shows funding minus fees only (cash flow from funding operations). The Stats tab's "Total P&L" includes price spread gains/losses as well, providing the complete P&L picture.
Dashboard Tabs
The dashboard has six main tabs, accessible with Tab and Shift+Tab:
📊 Dashboard Tab
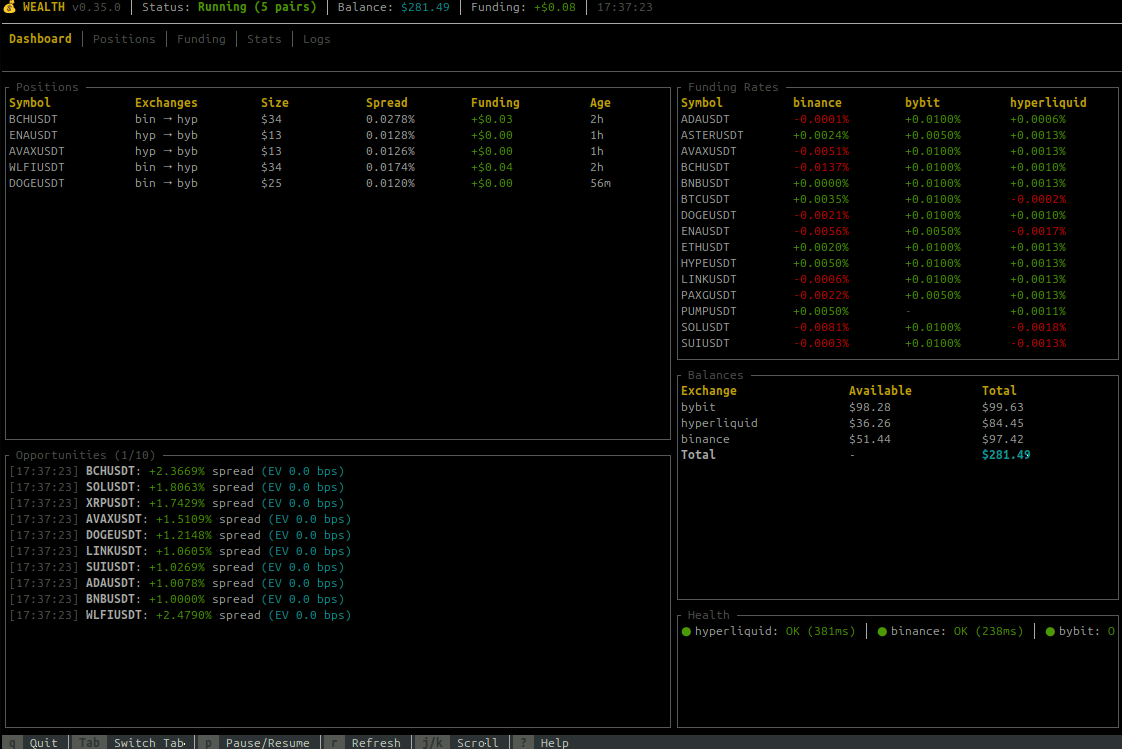
The overview tab shows:
- Bot Status - Running state, uptime, mode (paper/live)
- Health Summary - Exchange connectivity, WebSocket status
- Key Metrics - Total P&L, open positions, funding collected
- Recent Opportunities - Latest arbitrage opportunities with individual funding rates and EV
The opportunities panel displays:
- Validity indicator: Shows whether an opportunity meets trading thresholds
✓(green) - Executed opportunity●(cyan) - Valid opportunity (meets spread and EV thresholds)○(gray) - Invalid opportunity (below thresholds, shown for market context)
- Quality stars: Premium opportunities show ★★★ (gold) or ★★ (yellow)
- Symbol and exchange pair (long/short)
- Individual funding rates per leg (color-coded by magnitude)
- Leverage - Configured leverage for this symbol (e.g., "10x") or "max" if not configured
- Spread percentage
- Expected Value (EV) estimate
The title shows counts: Opportunities (1/50) [3● 1✓] means position 1 of 50, 3 valid opportunities, 1 executed.
📈 Positions Tab
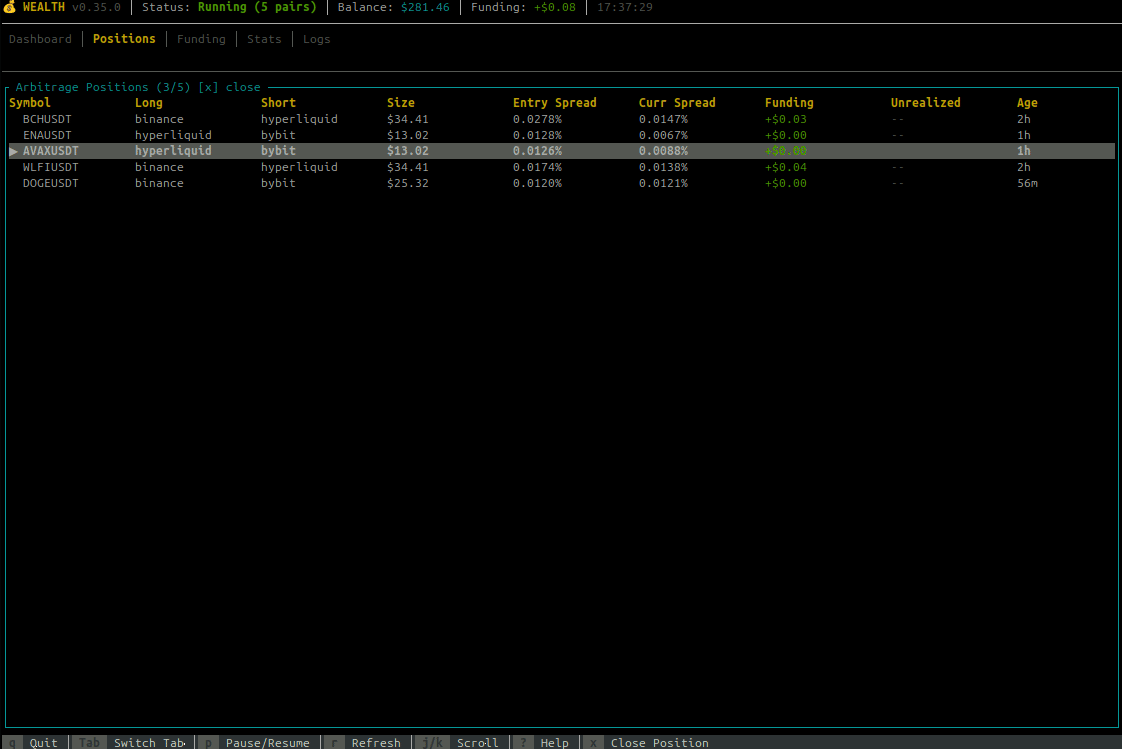
Monitor your active positions with comprehensive metrics and risk indicators:
Column Reference (Full View)
| Column | Description |
|---|---|
| Symbol | Trading pair with selection indicator (▶) |
| S | Status indicator (see below) |
| Route | Exchange pair (e.g., "Bin→Byb" for Binance→Bybit) |
| Size | Position size in USD |
| Lev | Leverage used (e.g., "10x") or "—" for legacy |
| Net | Net funding rate (short - long), what you earn per period |
| Spread | Current funding rate spread between exchanges |
| Trend | Sparkline showing spread history (last 8 data points) |
| APR | Annualized Percentage Rate based on current spread |
| PnL | Funding payments collected (USD) |
| ROI | Return on Investment percentage (fee-adjusted) |
| Next | Time until next funding payment |
| Liq% | Liquidation distance percentage |
| Age | Position duration |
Status Indicators (S Column)
| Icon | Meaning | Color |
|---|---|---|
| 🔒 | Position is held (bypass auto-close) | Yellow |
| ⚠ | Critical liquidation risk (<5%) | Red |
| ! | Warning liquidation risk (<10%) | Yellow |
| ✨ | Spread widening significantly | Green |
| ↓ | Spread narrowing significantly | Red |
| · | Normal status | Gray |
APR Color Coding
The APR column shows annualized returns with color-coded quality:
| APR Range | Color | Assessment |
|---|---|---|
| ≥100% | Bright Green | Exceptional |
| 50-100% | Green | Great |
| 20-50% | Cyan | Good |
| 10-20% | Yellow | Moderate |
| 0-10% | Gray | Low |
| <0% | Red | Negative |
Next Funding Countdown
Color-coded urgency for upcoming funding payments:
| Time Remaining | Color | Urgency |
|---|---|---|
| ≤5 minutes | Green | Imminent |
| ≤30 minutes | Yellow | Soon |
| ≤2 hours | Cyan | Upcoming |
| >2 hours | Gray | Normal |
Liquidation Distance (Liq%)
Estimated distance to liquidation based on leverage:
| Distance | Color | Risk Level |
|---|---|---|
| <5% | Red | Critical |
| 5-10% | Yellow | Warning |
| 10-20% | Cyan | Moderate |
| >20% | Green | Safe |
Spread Trend Sparkline
The Trend column displays a mini-chart using Unicode block characters (▁▂▃▄▅▆▇█) showing how the spread has evolved over recent data points. Rising patterns indicate improving opportunity, falling patterns suggest declining returns.
ROI Status Indicators
| Display | Meaning |
|---|---|
X.XX% | Actual ROI with confirmed fees from exchange |
X.XX%* | ROI with estimated fees (asterisk indicates estimation) |
... | Fees being fetched from exchange |
N/A | Legacy position without fee data |
Totals Row
A fixed summary row at the bottom shows portfolio totals:
- Total position count
- Combined size value
- Average APR (weighted by size)
- Total PnL
- Overall ROI percentage
Sorting Positions
Press s to cycle through sort columns:
Symbol → Size → PnL → ROI → Spread → APR → Age → Next Funding → (back to Symbol)
- The current sort column and direction (▲ ascending, ▼ descending) are shown in the title bar
- Direction toggles when cycling back to Symbol
Position Actions
Use j/k or arrow keys to select a position, then:
hto toggle hold status (held positions bypass auto-close)xto manually close the positionsto change sort order
Note: Scrolling is smart—arrow keys only scroll when there are more items than fit on screen.
🔗 Pairs Tab
Monitor and manage your trading pairs dynamically:
- Symbol - Trading pair symbol (e.g., BTCUSDT)
- Exchange - Exchange where the pair is tracked
- Status - Health status with color coding:
- 🟢 Healthy - Pair is functioning normally
- 🟡 Degraded - Some issues but still usable
- 🔴 Unhealthy - Pair has significant issues
- ⚪ Disabled - Pair has been manually disabled
- Enabled - Whether the pair is enabled for trading (✓ Yes / ✗ No)
- WS Disc - Consecutive WebSocket disconnection count
- API Err - Consecutive API error count
- Last FR Update - Time since last funding rate update
- Error - Last error message if any
Filtering Pairs
Press / to open the filter input. Type to filter pairs by symbol or exchange name:
- Filter matches both symbol (e.g., "BTC") and exchange (e.g., "binance")
- Case-insensitive matching
- Press
EnterorEscto close filter input - Press
cto clear the filter
The title bar shows the active filter: [filter: btc]
Sorting Pairs
Press s to cycle through sort columns:
Symbol → Exchange → Status → Enabled → WS Disc → API Err → (back to Symbol)
- The current sort column shows an indicator in the header (▲ ascending, ▼ descending)
- Direction toggles when cycling back to Symbol
Pair Management Controls
| Key | Action |
|---|---|
/ | Toggle filter mode (type to search) |
s | Cycle sort column |
c | Clear filter |
e | Toggle enable/disable for selected pair |
a | Add a new pair (opens input dialog) |
x or Del | Remove selected pair (with confirmation) |
j/k or ↑/↓ | Navigate between pairs |
Dynamic Pair Management
Pairs can be added or removed at runtime without restarting the bot:
- Enable/Disable: Temporarily stop trading a pair while keeping it tracked
- Add Pair: Add a new trading pair to the active list
- Remove Pair: Remove a pair from trading entirely
Note: Runtime changes are not persisted to config.toml. To permanently add/remove pairs, update your configuration file.
💰 Funding Tab
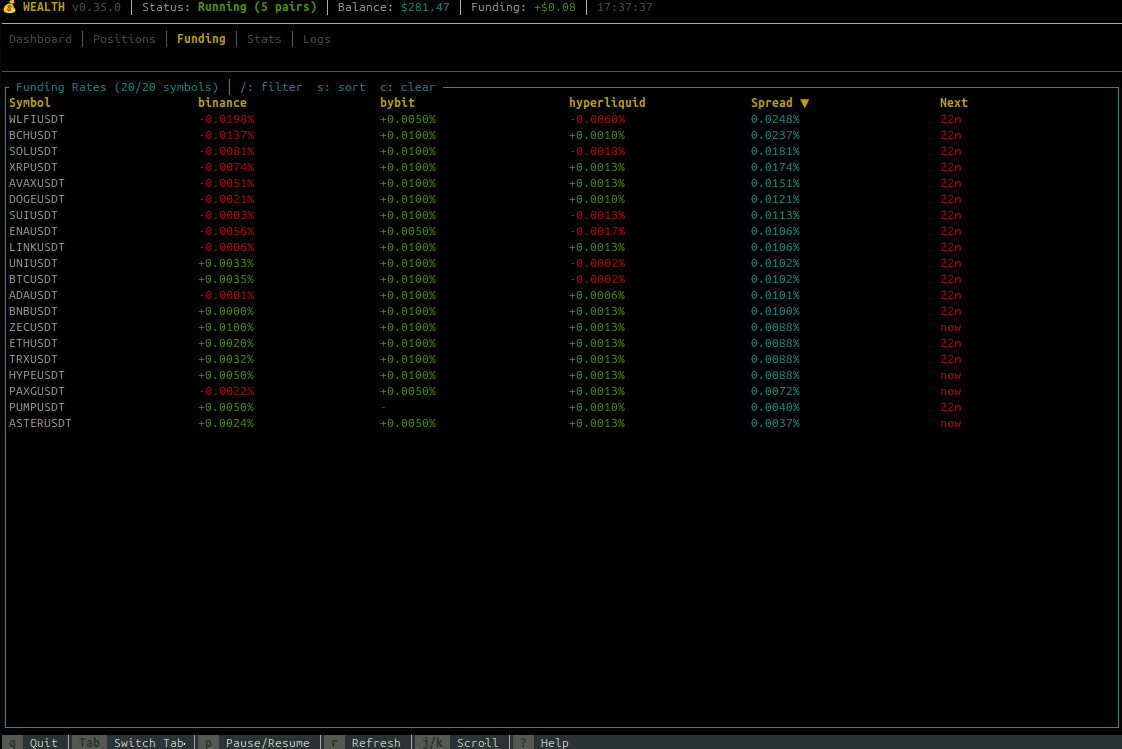
Live funding rates across all exchanges:
- Real-time rates updated every tick
- Color-coded rates (green for positive, red for negative)
- Annualized rate display
- Next funding countdown timer
- Spread between exchanges highlighted
Positions/Opportunities Rate Colors: The individual funding rates in Positions and Opportunities panels use a gradient color scheme:
- Bright green: ≤ -0.05% (receiving significant funding)
- Green: Negative rates (receiving)
- Yellow: 0% to < 0.05% (low cost)
- Orange: 0.05% to < 0.1% (moderate cost)
- Red: ≥ 0.1% (high cost)
Note: Scrolling is dynamic—only activates when funding pairs exceed the visible area.
📊 Statistics Tab
Comprehensive trading analytics and metrics dashboard with six sections.
Responsive Layout: The Stats tab adapts to terminal size:
- ≥35 rows: All sections visible
- 25-34 rows: Session Activity hidden
- <25 rows: Session Activity + Risk Metrics hidden
Overview, Performance, and Breakdown sections are always visible.
Overview Section
- Active Positions - Currently open positions count
- Position Value - Sum of all active position sizes in USD (not total wallet balance)
- Total P&L - Net session P&L including price spread gains, funding collected, and fees paid (with trend indicator ▲/▼)
- Uptime - Duration since bot/session start
Performance Section
- PnL % - Percentage profit/loss relative to position value
- Win Rate - Percentage of profitable trades (green ≥50%, yellow 30-50%, red <30%)
- Daily P&L - Extrapolated daily profit/loss based on current performance
- Funding Collected - Total funding payments received this session
- Fees Paid - Total trading fees paid this session (shown as negative cost)
Risk Metrics Section
- Max Drawdown - Peak-to-trough decline in USD (stat box, not gauge)
- Current DD - Current drawdown from last peak in USD (stat box)
- Portfolio Util - Positions used vs max allowed (visual gauge, shows X/Y)
- Exposure Util - Current exposure vs total balance (visual gauge, shows $XK/$YK or "N/A" if balance data unavailable)
Visual gauges provide at-a-glance risk assessment with color-coded thresholds:
- Green (<50%): Safe operating range
- Yellow (50-80%): Moderate utilization
- Cyan (≥80%): High utilization
Session Activity Section
- Trades Executed - Total trades executed this session (opens + closes)
- Pos. Opened - Positions opened this session
- Pos. Closed - Positions closed this session
- Funding Events - Number of funding payments received this session
Exchange Breakdown Section
A detailed table showing per-exchange statistics:
| Column | Description |
|---|---|
| Exchange | Exchange name |
| Long | Number of long positions on this exchange |
| Short | Number of short positions on this exchange |
| Value | Position exposure on this exchange (half of total position value since each position spans two exchanges) |
| Funding | Funding collected (split 50/50 between exchanges as approximation) |
Position Breakdown Section
Groups positions by exchange pair (e.g., "Binance ↔ Bybit") showing:
- Number of positions in that pair
- Combined size value
- Total funding collected from active positions (may differ from session total if positions were closed)
Scrollable with position indicator when content exceeds visible area.
P&L Trend Indicator: The Total P&L displays a colored arrow showing recent direction:
- ▲ (green): P&L increasing
- ▼ (red): P&L decreasing
�📜 Logs Tab
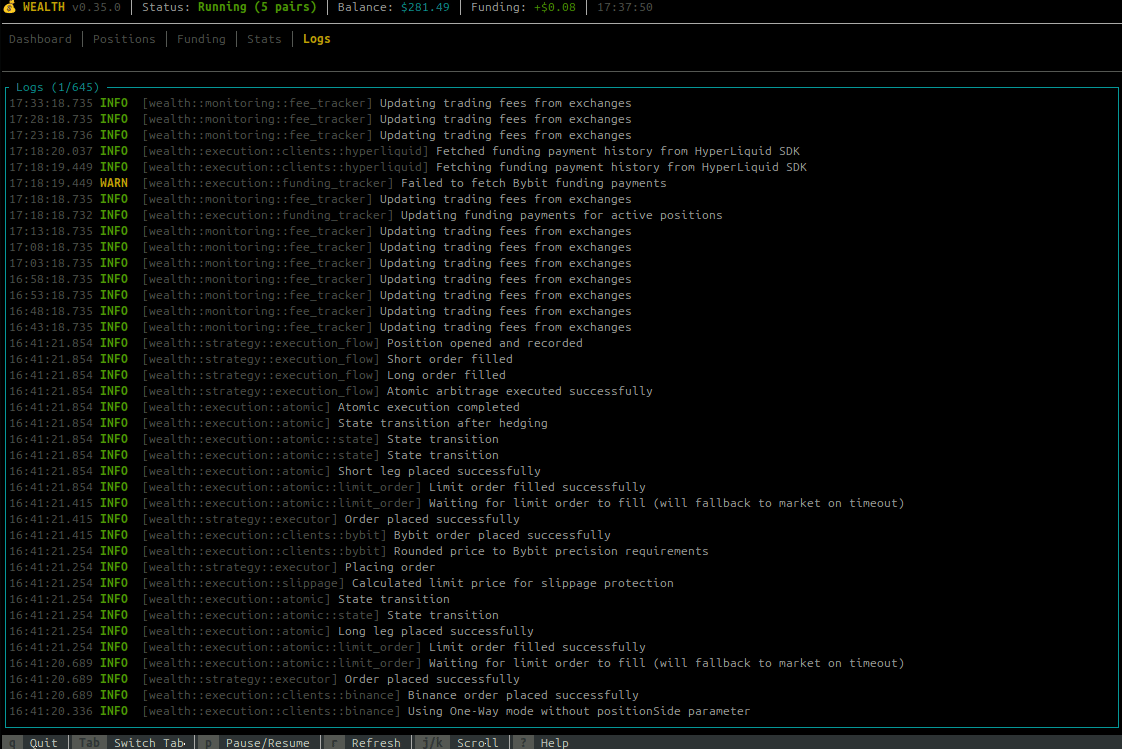
Real-time event viewer:
- Scrollable log history
- Color-coded log levels (INFO, WARN, ERROR)
- Trade executions, funding payments, system events
- Use
j/kto scroll through history
Keybindings
Navigation
| Key | Action |
|---|---|
Tab | Switch to next tab |
Shift+Tab | Switch to previous tab |
1-5 | Jump to specific tab |
Scrolling
| Key | Action |
|---|---|
j or ↓ | Scroll down / Next item |
k or ↑ | Scroll up / Previous item |
g or Home | Go to top |
G or End | Go to bottom |
Page Up | Scroll up one page |
Page Down | Scroll down one page |
Smart Scrolling: Scroll keys only have effect when content exceeds the visible area. If all items fit on screen, scrolling is automatically disabled to prevent hiding content.
Actions
| Key | Action |
|---|---|
p | Pause/Resume trading bot |
r | Force refresh data |
s | Cycle sort column (Positions, Pairs & Funding tabs) |
/ | Toggle filter mode (Pairs & Funding tabs) |
c | Clear filter (Pairs & Funding tabs) |
h | Toggle hold status (Positions tab) |
x or Del | Close selected position / Remove pair |
e | Toggle pair enable/disable (Pairs tab) |
a | Add new pair (Pairs tab) |
l | Cycle log level filter (Logs tab) |
? or F1 | Toggle help overlay |
q | Quit dashboard |
Hold Position Feature
The hold feature allows you to protect specific positions from being automatically closed by the bot's exit conditions (profit target, spread reversal, trailing stop, etc.).
How to Use
- Navigate to the Positions tab
- Select a position using
j/kor arrow keys - Press
hto toggle the hold status
Visual Indicators
- 🔒 - Lock icon appears in the "H" column for held positions
- The title bar shows the count of held positions (e.g., "│ 2 held")
Behavior
When a position is held:
- ✅ Continues collecting funding payments normally
- ✅ Displayed in TUI with all metrics
- ✅ Preserved during graceful shutdown (not closed on Ctrl+C)
- ❌ Bypassed by all auto-close mechanisms:
- Spread reversal exits
- Duration-based exits
- Trailing stop triggers
- Profit target exits
- Spread narrowing exits
To close a held position, you must manually press x or Del.
Note: Held positions persist across bot restarts. When you restart the bot, held positions remain open on exchanges and will be tracked again.
Use Cases
- Strong conviction: Hold positions you believe will continue earning
- Temporary protection: Prevent premature closing during volatile periods
- Manual management: Take full control of specific high-value positions
Closing Positions
When you press x on a selected position, a confirmation dialog appears:
┌─ Close Position ─────────────────┐
│ Close position BTCUSDT?          │
│                                  │
│ Long: Binance                    │
│ Short: Bybit                     │
│ Size: $1000.00                   │
│                                  │
│ [Y] Yes  [N] No  [Esc] Cancel    │
└──────────────────────────────────┘
- Press
Yto confirm and close the position - Press
NorEscto cancel
The bot will atomically close both legs of the position with rollback protection.
Configuration Options
Command Line Options
wealth dashboard [OPTIONS]

Options:
  --enable-discovery     Enable dynamic pair discovery
  --tick-rate <MS>       UI refresh rate in milliseconds (default: 250)
  -v, -vv, -vvv          Verbosity level
  -c, --config <FILE>    Custom config file
Tick Rate Recommendations
| Environment | Tick Rate | Notes |
|---|---|---|
| Local | 100-250ms | Smooth updates |
| LAN | 250-500ms | Good balance |
| Remote/SSH | 500-1000ms | Reduces bandwidth |
| Slow connection | 1000-2000ms | Minimal updates |
Dashboard vs Headless Mode
| Feature | wealth dashboard | wealth run |
|---|---|---|
| Interface | Interactive TUI | Headless (logs only) |
| Resource usage | Higher (rendering) | Lower |
| Best for | Development, monitoring | Production, servers |
| Position management | Visual with keyboard | API/CLI only |
Troubleshooting
TUI Not Available
If you see "TUI feature not enabled":
# Check if binary was built with TUI
wealth dashboard
# Error: TUI feature not enabled

# Rebuild with TUI feature
cargo build --release --features tui
Display Issues
Garbled output:
# Reset terminal
reset

# Try different terminal emulator
# Recommended: kitty, alacritty, wezterm, iTerm2
Colors not showing:
# Ensure TERM is set correctly
export TERM=xterm-256color
wealth dashboard
Too small:
# Minimum recommended size: 80x24
# Resize terminal or reduce font size
SSH/Remote Issues
# Use slower tick rate
wealth dashboard --tick-rate 1000

# Enable SSH compression
ssh -C user@host

# Use mosh for better responsiveness
mosh user@host -- wealth dashboard
Related
- CLI Reference - Full command documentation
- Getting Started - Initial setup
- Monitoring - Grafana dashboards for production